
The gestational sac is the first visible structure on ultrasound at the beginning of pregnancy. At 5 weeks of amenorrhea (WA), its measurement is based on the mean diameter, a parameter whose normal dispersion is wider than many patients imagine. Understanding the reference values, their variability, and the limits of this isolated measurement allows for the interpretation of an early ultrasound without premature conclusions.
Beta-hCG threshold and visibility of the gestational sac at 5 WA
Before reading a size chart, it is essential to know under what conditions the gestational sac becomes visible. Detection directly depends on the circulating beta-hCG level and the type of probe used.
With a transvaginal ultrasound, an intrauterine sac is visible in about 50% of cases around 1,000 mUI/mL of beta-hCG. This percentage rises to nearly 99% at around 4,000 mUI/mL. Therefore, a sac not detected at 5 WA does not automatically indicate a problem: if the beta-hCG level remains below these thresholds or if the conception dates are uncertain, the pregnancy can be perfectly viable.
This inter-individual variability has led, in recent years, to a revision of the concept of “discriminating hCG.” Practitioners now avoid making a definitive diagnosis based on a single measurement coupled with a single image. By consulting the size chart of the gestational sac at 5 weeks, one can see that the normal range covers very different situations depending on the hormonal level at the time of the examination.

Average diameter chart of the gestational sac between 4 and 9 WA
The most cited reference curves, particularly those by Pexsters et al. (2010, Human Reproduction), are based on thousands of normal pregnancies. The table below summarizes the average diameter values and their range of variation.
| Gestational Age | Average Diameter (mm) | Normal Variation (mm) |
|---|---|---|
| 4 WA | 5 | 2 to 8 |
| 5 WA | 10 | 6 to 16 |
| 6 WA | 16 | 9 to 23 |
| 7 WA | 23 | 15 to 31 |
| 8 WA | 30 | 22 to 38 |
| 9 WA | 37 | 28 to 46 |
At 5 WA, the diameter varies from 6 to 16 mm for a normal pregnancy. A sac measured at 7 mm and another at 15 mm can both correspond to a perfectly normal embryonic development. This range of 10 mm makes any interpretation based on a single measurement unreliable.
What the average diameter actually measures
The average diameter of the gestational sac is calculated by adding three orthogonal measurements (height, width, depth) and then dividing by three. This method smooths out shape irregularities, which are common at this stage. A slightly oval sac may show a diameter in one axis significantly greater than another, without indicating an anomaly.
At 5 WA, the embryo measures between 1 and 2 mm. It appears as a faint echo inside the gestational sac, surrounded by the trophoblastic ring. Cardiac activity is not yet systematically detectable at this stage, which is not in itself a warning sign.
British NICE NG126 criteria and the 25 mm threshold
The NICE NG126 recommendations (United Kingdom) have tightened the criteria before concluding a non-viable pregnancy. This change has direct consequences on the interpretation of a gestational sac observed at 5 WA.
As long as the average diameter of the sac remains below 25 mm without a visible embryo, a second ultrasound is recommended at least 14 days later. Before these recommendations, diagnoses of stopped pregnancy were sometimes made too early, based on a sac deemed “too small” or “empty” during a single examination.
These criteria apply in cases of a visible sac without an identifiable embryonic pole, a situation common at 5 WA since the embryo is sometimes only detectable from a sac diameter of about 10 mm, and even then inconsistently.
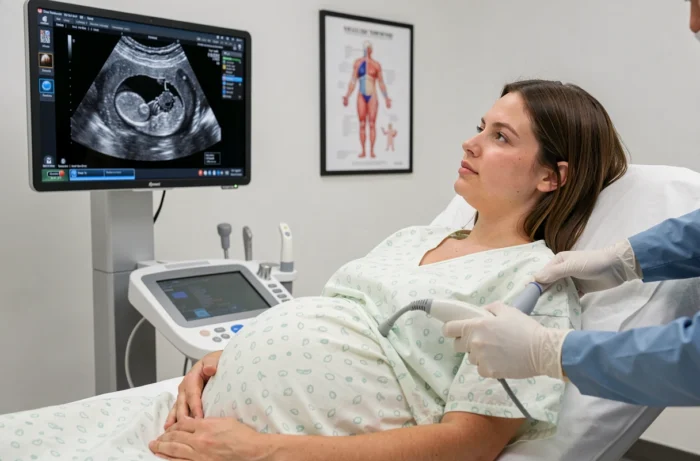
Why a 14-day follow-up changes the game
A two-week interval allows for the assessment of growth kinetics, a parameter more informative than absolute size. The gestational sac typically grows by about 1 mm per day in the first trimester. A sac measured at 8 mm at 5 WA should therefore be around 22 mm two weeks later.
The elements that the practitioner considers during the follow-up are numerous:
- The progression of the average diameter of the sac between the two examinations, compared to the expected curve
- The appearance or not of an embryonic pole with cardiac activity
- The presence and size of the yolk sac, normally visible before the embryo
- The evolution of the beta-hCG level, whose doubling in 48 hours remains an indicator of vitality
The growth kinetics take precedence over a single measurement: a sac that progresses steadily, even if it is at the lower end of the range, is more reassuring than an initially large sac whose growth stagnates.
Ultrasound at 5 WA: limitations of the image and interpretation precautions
Transvaginal ultrasound remains the reference tool at this stage. The endovaginal probe, closer to the uterus, offers superior resolution compared to the abdominal route. At 5 WA, the abdominal route alone detects the gestational sac less reliably, especially in patients with a retroverted uterus or a high body mass index.
Several situations make reading the image challenging:
- A pseudo-gestational sac related to an ectopic pregnancy can mimic a normal intrauterine sac
- A decentered sac in the uterine cavity may correspond to a low implantation, without consequence at this stage
- The absence of a yolk sac at 5 WA is not pathological, as it becomes more consistently visible around 5.5 to 6 WA
A single examination at 5 WA is not sufficient to make a diagnosis. The data measured on that day serve as a starting point, not a verdict. The correlation between the sac diameter, beta-hCG level, and growth kinetics over two spaced examinations forms the basis for a reliable interpretation.
The dating ultrasound, performed later between 7 and 9 WA, will measure the crown-rump length of the embryo with an accuracy of a few days. It is this measurement that will set the reference term, not the diameter of the sac observed at 5 weeks of amenorrhea.